The transition shapes how tension is distributed across the belt. That distribution affects pressure, shear and slip at the pulley. Compare unworn and specified worn profiles to see how a change in the lagging surface changes contact and cable loading.
01Transition geometryUnequal cable extension and loading
02Pressure & shearDemand and available friction vary
03Local slip & workContact solution and material response
04Material lossRadius and compliance change
↻Redistributed loadingChanged cable loads and contact
Compare local shear demand with the friction capacity set by pressure and the selected friction model.
See where contact changes
Inspect pressure, shear traction, slip and sliding work across the pulley. Bring transition-derived loading into the contact study to explore the effect of unequal belt tension.
Compare cable loading
View mapped cable forces alongside the lagging profile. Keep the belt and operating duty consistent while comparing the effect of different wear shapes.
Computed engineering example
Start unworn. Locate the sliding demand.
Uniform 12 mm lagging
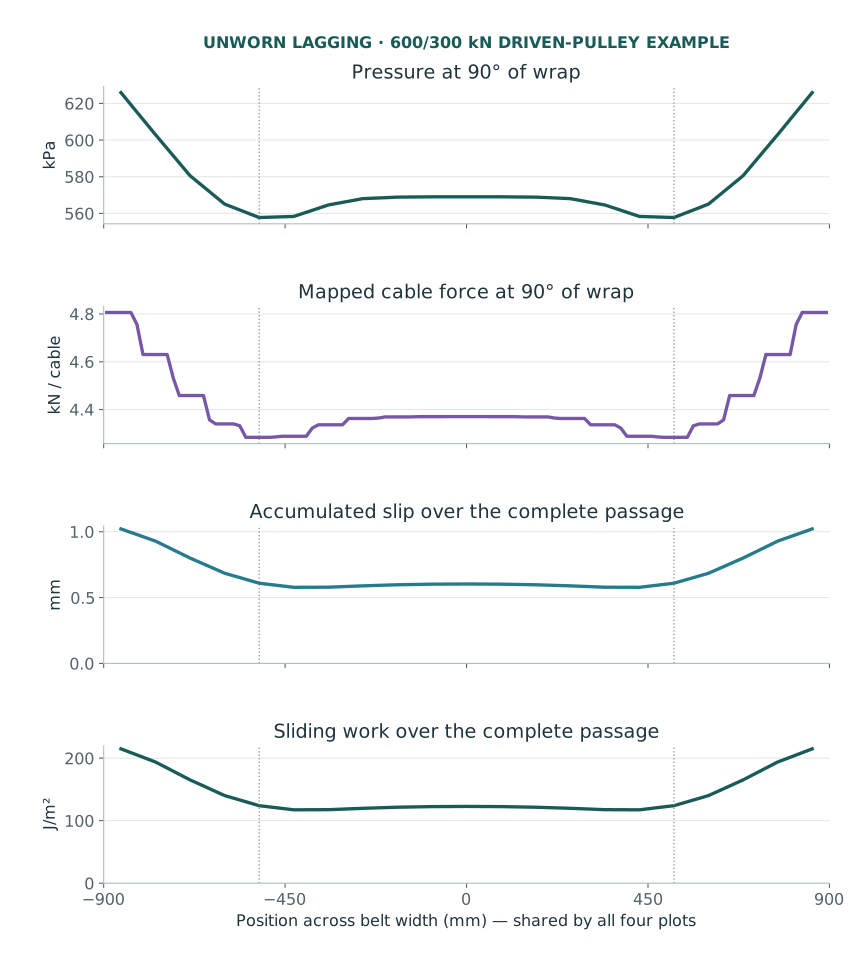
Follow pressure, cable loading, slip and sliding work across the same belt width. This illustrative driven pulley has 600/300 kN entry/exit tensions and a transition-derived inlet.
Minimum pressure at 90°558 kPa
Maximum passage slip1.02 mm
Peak sliding work / passage215 J/m²
Every plot uses the same position across the belt. Dotted lines mark the sampled pressure minima at 90° of wrap. Slip and work accumulate over the complete 180° contact passage. Open aligned charts full size.
Read the fields together. In this case, the pressure minima lie about 514 mm either side of center. The outer sampled strips carry the greatest sliding work: about 215 J/m² per passage, compared with 123 J/m² at the center. Pressure sets friction capacity; local shear demand and relative sliding determine how that capacity is used.
Example inputs and calculation
1,000 mm steel diameter; 1,800 mm belt width; uniform 12 mm rubber lagging; 6 mm contacting belt cover; 180° wrap; 600/300 kN entry/exit tension; 5 m transition; 35° trough; 100 mm pulley tangent elevation. Rubber shear modulus is 1 MPa for both layers and the assumed friction coefficient is 0.6.
The contact field uses 21 width strips and 240 arc intervals. The upper two plots show the same 90° station. Cable forces are mapped by integrating belt tension over each cable’s tributary width. The lower two plots sum slip and frictional work over the full passage. For this baseline, sliding first appears near the outer width samples at 166.5° of wrap.
The starting lagging is unworn throughout. These fields describe the contact demand from which a material-specific wear law can calculate a wear increment. Each changed profile then requires a new mechanical solution.
See what the rubber carries through the loading cycle.
Examine the pressure, shear and elastic deformation carried by the lagging and belt cover. Relate those contact results to the repeated loading that matters for rubber fatigue.
LAGGING PATCHOnce per pulley revolution
Each patch enters contact, carries load, leaves the belt and returns with the shell.
BELT-COVER PATCHOnce per belt circuit
Each patch passes through the conveyor before returning to this pulley.
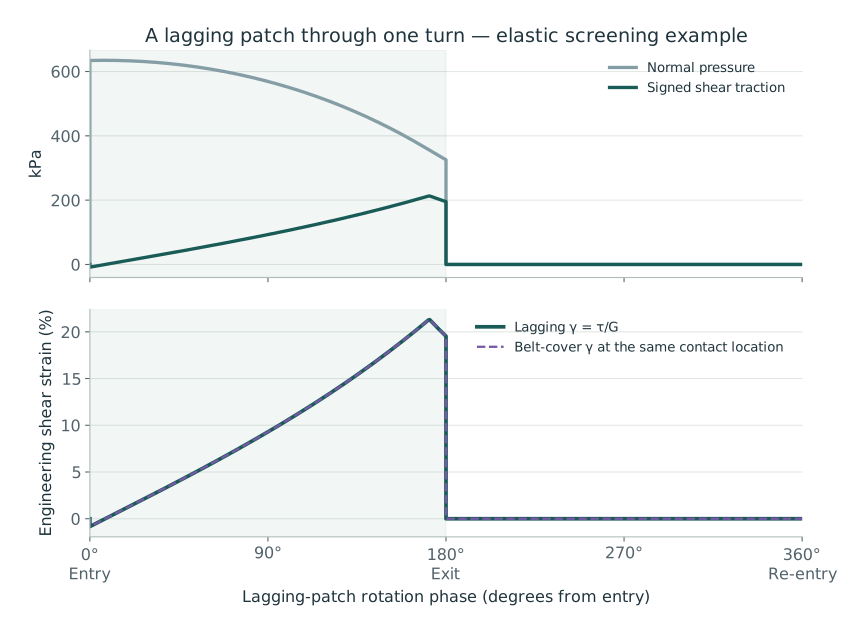
Elastic example for the center lagging strip through 180° of contact and an unloaded half-turn. The belt-cover trace shows strain at the same contact location. Open cycle chart full size.
Inspect the rubber response
Read normal pressure, signed shear traction, elastic deformation and interface slip together. See how the lagging and contacting belt cover carry the applied demand.
Explore your engineering choices
Compare layer thickness, shear stiffness, friction and operating tension. Connect material choices to calculated contact behavior and rubber deformation.
How this example is calculated
The chart maps the steady center-strip contact solution onto one lagging revolution. It uses homogeneous elastic layers with immediate unloading outside contact. Both layers have a shear modulus of 1 MPa, so their shear-strain traces coincide. The belt-cover trace represents the rubber at each contact location; a particular belt patch has its own full-circuit history.
These plots describe elastic mechanical demand. Fatigue assessment connects a material’s loading history with compound-specific test data and a defined failure criterion.
03 · Pulley-specific installation
Put the specified lagging on the actual pulley.
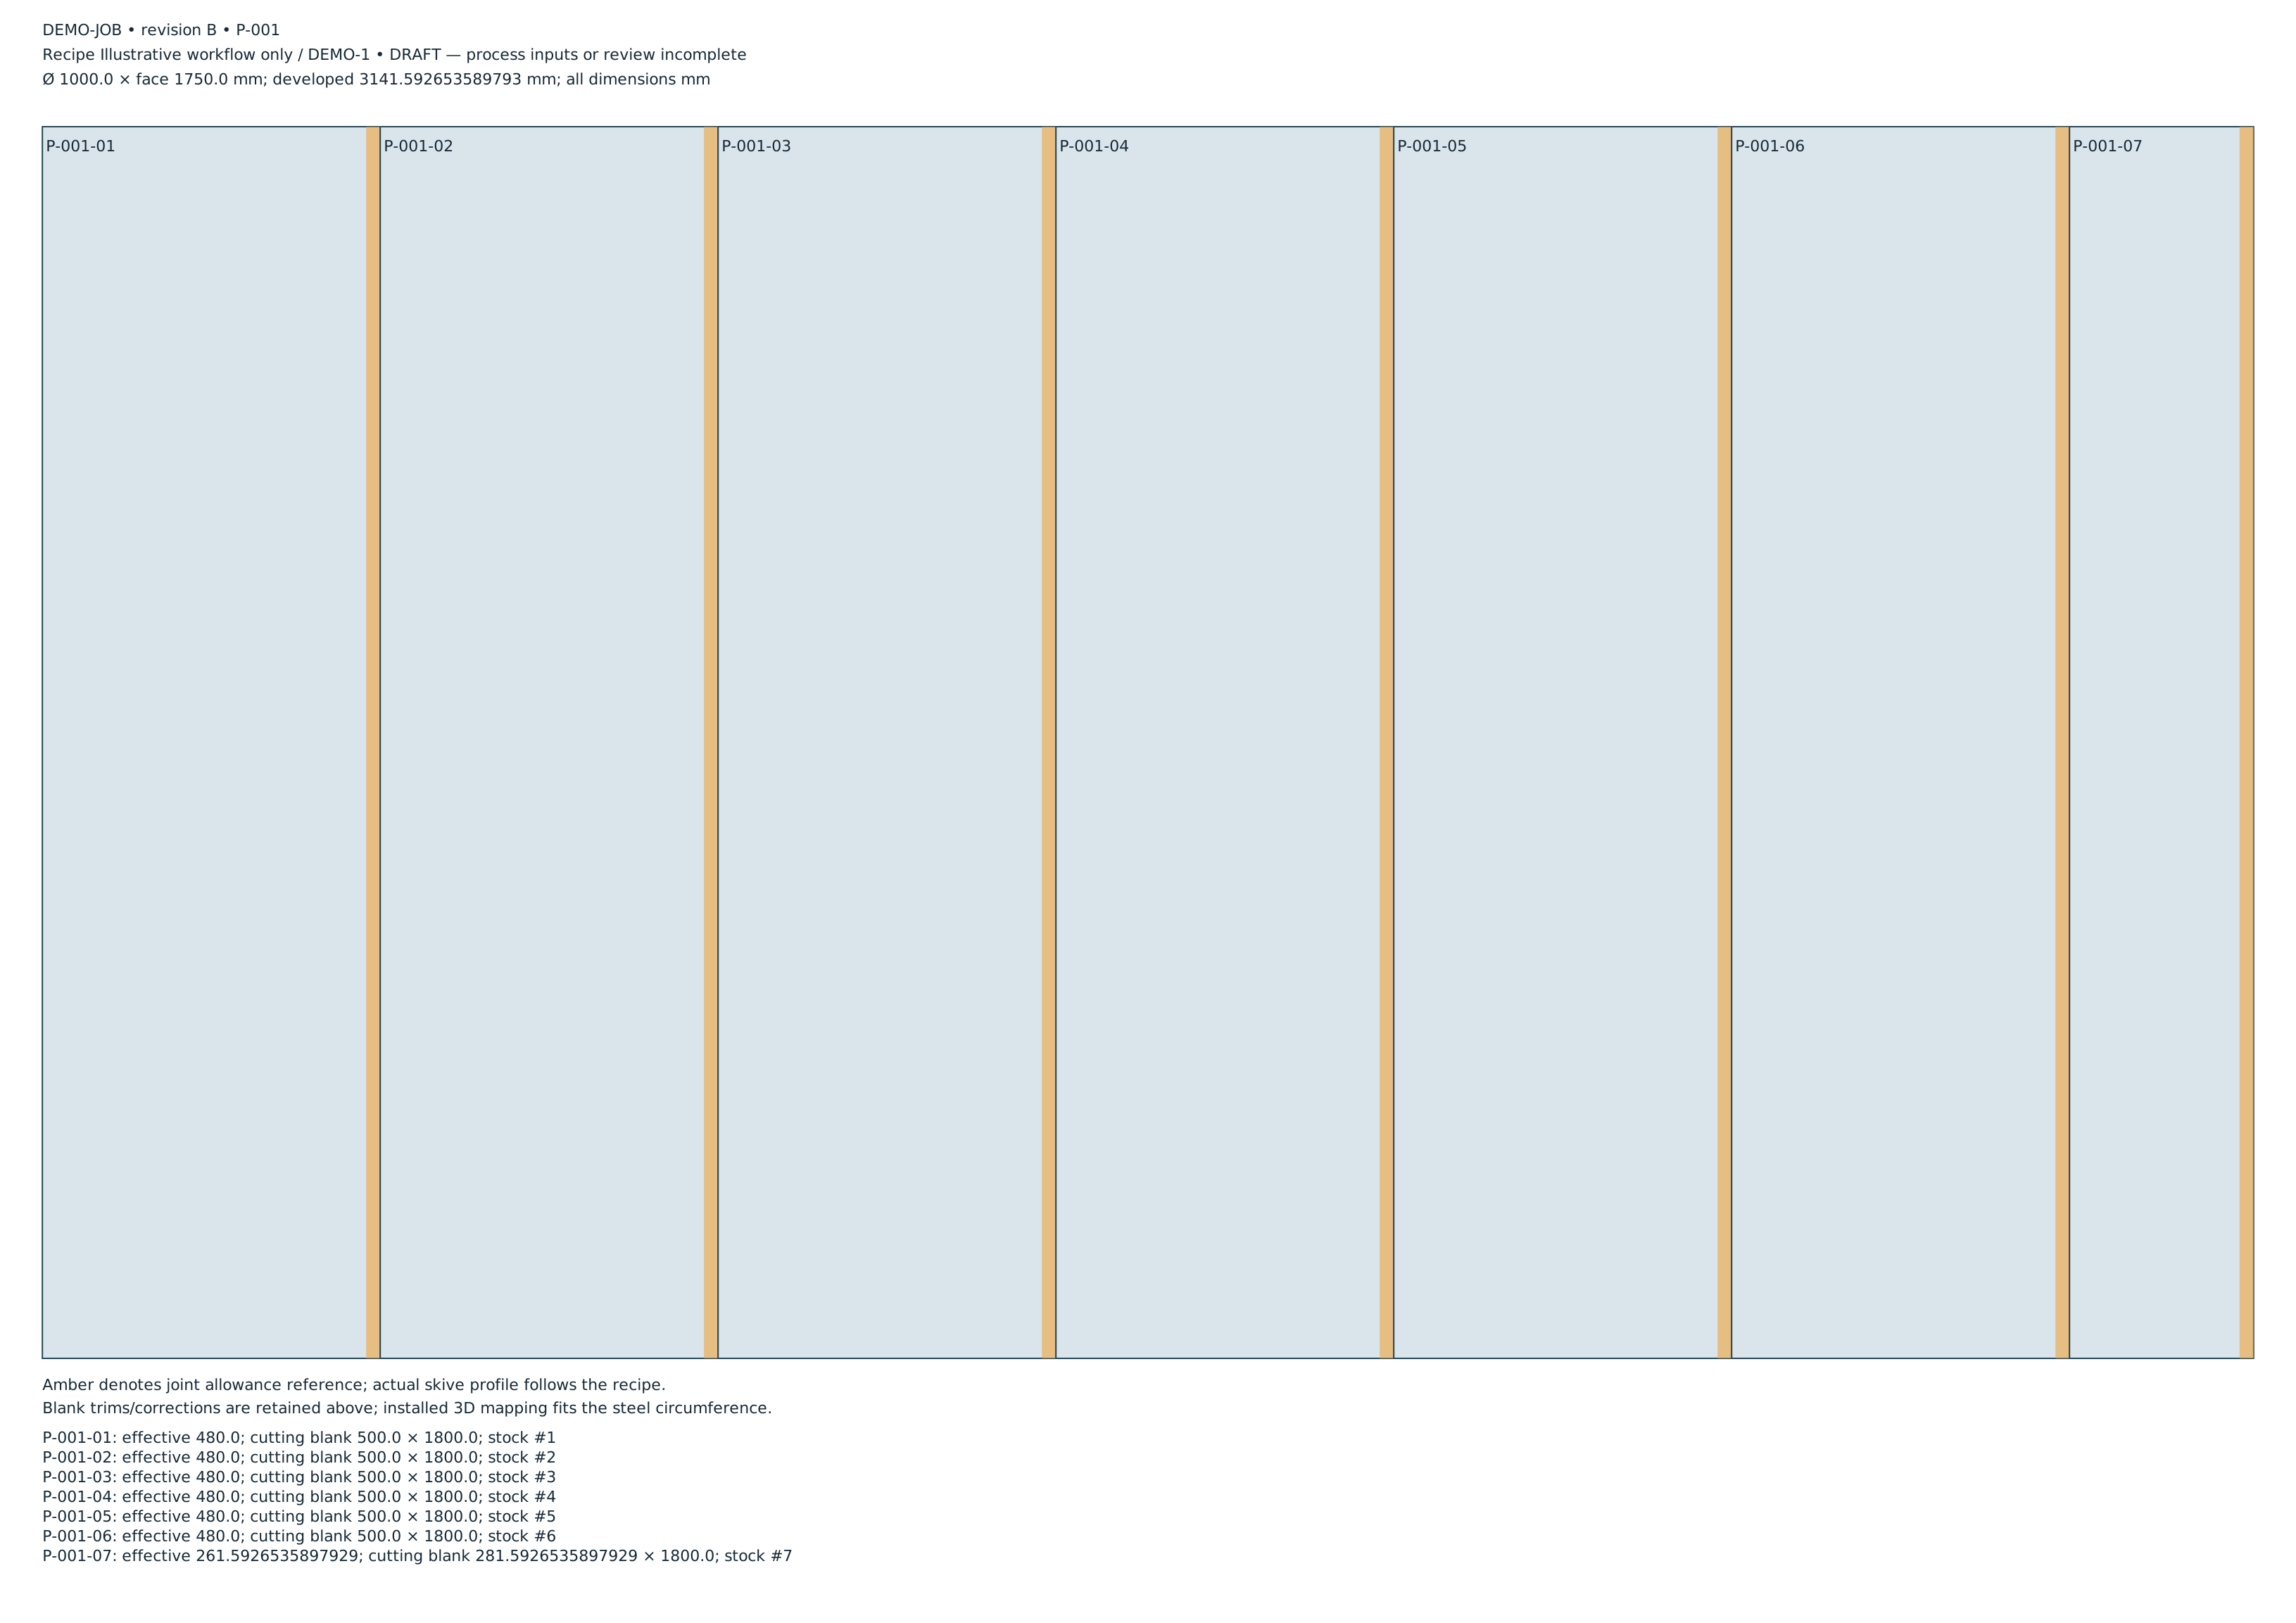
Use the pulley dimensions, selected lagging, attachment system and manufacturer procedure to prepare a job-specific layout, material estimate and inspection record. Give the installation team a clear plan and a shared reference.
LAY OUT AND ALIGN
Establish the reference
Record shell and finished dimensions, strip or sheet layout, seam positions and groove orientation. Secure the pulley, establish a line parallel to its shaft, and align the first strip. Check shaft level when using a level to establish that line.
APPLY AND VERIFY
Keep the process specific
Keep surface preparation, backing treatment, chemical identities, coat and cure requirements, quantities and labor with the job. Record finished dimensions, bond evidence, inspection and the responsible release decision.
Share the installation plan
A numbered layout, illustrated instructions and an animated placement sequence give the team a common reference. See the schematic placement sequence in this example export.
20-second silent schematic preview. Stage text is available in the illustrated sequence. Follow the procedure for the selected lagging and adhesive system.
Keep pulley dimensions, belt data, material choices, calculations and the installation plan together. Save your project, compare engineering inputs and share the layouts and instructions your team needs.
One monthly subscription
All your workspaces. One straightforward plan.
Contact and wear-profile studies, cable-loading tools, surface design, installation planning, costing and exports across your supported Apple devices.
Subscribe with your Apple Account. Keep your project files in the locations you choose.
Lagging Maven Monthly
US$5 / month
First 14 days free for eligible new subscribers.
Automatically renews monthly after the trial unless canceled. Local App Store prices vary; Apple displays your price and eligibility before purchase. Cancel at least 24 hours before the trial ends to avoid a charge.
Compare specified wear profiles, transition-derived inlet loading, operating tensions, friction and rubber-layer properties. Inspect the resulting pressure, shear, slip and mapped cable forces to understand how those choices affect the contact.
What can I share with the installation team?
Export numbered SVG layouts, illustrated HTML sequences, schematic MP4 placement animations and installer information. Keep quantities, costs, supplier references and inspection evidence with the job.
Which installation layouts can it plan?
Plan cylindrical shells with full-wrap sheets or full-face axial strips, plus materials for autoclave jobs. Explore groove patterns and ceramic coverage in the surface studio.
What happens if I cancel?
Your project files remain yours. You can continue to open and save them and read the model documentation after subscription access ends.
Does my subscription work on my other devices?
Use the same Apple Account and Restore Purchases on Mac, iPhone, iPad or Apple Vision Pro. Transfer project files between devices through the file locations you choose.
What does the free trial include?
Explore all subscription workspaces for 14 days when eligible for Apple’s introductory offer. Apple displays your eligibility and local price before you subscribe.
Bring your pulley question.
A changing wear profile, a demanding shear cycle, or an installation to plan. Start with the belt, pulley, material and operating conditions.